Portefeuilles Dynamiques

Créez, analysez et optimisez vos portefeuilles multi-actifs facilement.

A laptop displaying a stock market graph with a rising trend is placed on a desk. Next to the laptop are several books stacked on each other, with titles related to investing. A mouse is positioned to the right of the laptop.
Gestion Multi-Actifs

Accédez aux marchés mondiaux et gérez vos investissements.

A person is sitting at a wooden table, looking at a smartphone and a laptop. Both screens display stock market charts and data. The person is holding the phone in one hand while the other hand rests on the laptop keyboard.
Base de Données

Explorez notre base de données des ETFs et cryptomonnaies.

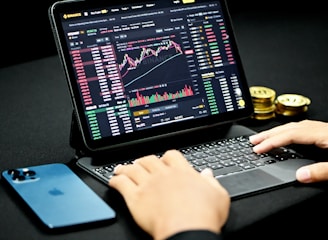
A person is typing on a laptop keyboard while looking at a cryptocurrency trading platform displayed on a tablet screen. Charts and price data are visible. Nearby is a smartphone and a stack of gold coins on the desk.
A three-dimensional cube with words on its visible sides, featuring 'LEARN' on the top, 'SAVE' on the left face, and 'INVEST' on the right face. The cube is rendered in a minimalist white and gray color palette, creating a clean and professional look.
Visualisations Interactives

Profitez de visualisations pour analyser vos portefeuilles efficacement.

Métriques Financières

Accédez aux métriques essentielles pour optimiser vos investissements.

Portefeuilles Dynamiques

Créez, analysez et optimisez vos portefeuilles multi-actifs avec des visualisations interactives et des métriques essentielles.

Gestion Multi-Actifs

Accédez aux marchés américains, européens et mondiaux pour gérer vos actions, ETFs et cryptomonnaies.

A person holds a smartphone displaying a stock market application with graphs and financial data. A laptop is visible in the background, slightly blurred.
Analyse de Portefeuille

Optimisez vos investissements avec des outils d'analyse avancés et des données en temps réel sur les marchés.

Intégration Cryptomonnaies

Suivez les principales cryptomonnaies via des API fiables pour une gestion complète de votre portefeuille.
A hand holding a smartphone in front of a wooden background. The phone screen displays a financial investment application with the text 'The smartest thing to do with your money'. Below it, there are illustrations of stacked coins and a call-to-action button labeled 'Start investing'.
A hand is holding a smartphone displaying a financial application. The screen shows a chart with a growth prediction in percentage, and sections labeled Personal, Retirement, and Custodial. The chart predicts cash invested and saved over a period of time, with specific dollar values provided for future growth.

Ce site m'a permis d'optimiser mes portefeuilles multi-actifs facilement. Les visualisations interactives sont incroyables et les données financières sont précises.

Jean Dupont

A laptop displays a financial trading platform with a candlestick chart showing stock market data. The chart is colorful, with blue and orange bars representing volume, and fluctuating lines indicating stock prices over time. Surrounding the laptop are two small potted plants on a white surface.

★★★★★